A. Kaniyoor
Hello World!
Imagine you have just discovered a new material, or simply an easier and more efficient way of making a material. How would you ensure that this material can be made consistently and reliably in large volumes? The “material” could be an exotic atomically thin semiconductor. It could be a life-saving drug. It could also be a delicious Red-velvet – you get the point. No, this is not a LinkedIn question that you’ve been specially selected to answer. The answer that I’m thinking of is, “through a Process” or ” through process development”.
Table of Contents
Quote
“Matches are made in heaven, all others require a process”
– Author
What is a Process?
As a materials scientist, I think of a manufacturing process as a Method of making Materials using Machines that can be Monitored, reliably Measured, and statistically analysed (Maths). Each of these 6M’s stands for a critical aspect of manufacturing or material production. Together, they form a framework that ensures consistency, quality, and efficiency. I assure you, it’s got nothing to do with the topics that I’d like to discuss via these blogs. ;)
Those familiar with the 6M RCA (root-cause analysis) and the DMAIC (Define-Measure-Analyse-Improve-Control) problem-solving approaches can see the similarities. The first three M’s are from RCA whereas the next three M’s are the action oriented steps from DMAIC. Why a different definition of 6M then? I believe, the 6M’s defined above are more relevant when understanding or developing a process. In contrast, DMAIC and RCA are for solving problems as and when they arise. Let’s delve deeper into the 6 M’s:
Method
The Method refers to the way of making the material i.e., a sequence of steps or protocols established to produce a desired outcome. It includes recipes, standard operating procedures (SOPs), workflows, process designs, and whether the approach is manual or automated (i.e. Manpower from RCA). This ensures reproducibility and minimises variability in production. Key considerations include:
- Are the steps well-documented?
- Is there room for improvement or optimisation?
- Are operators trained to follow these methods consistently?
- Is the method manual or automated?
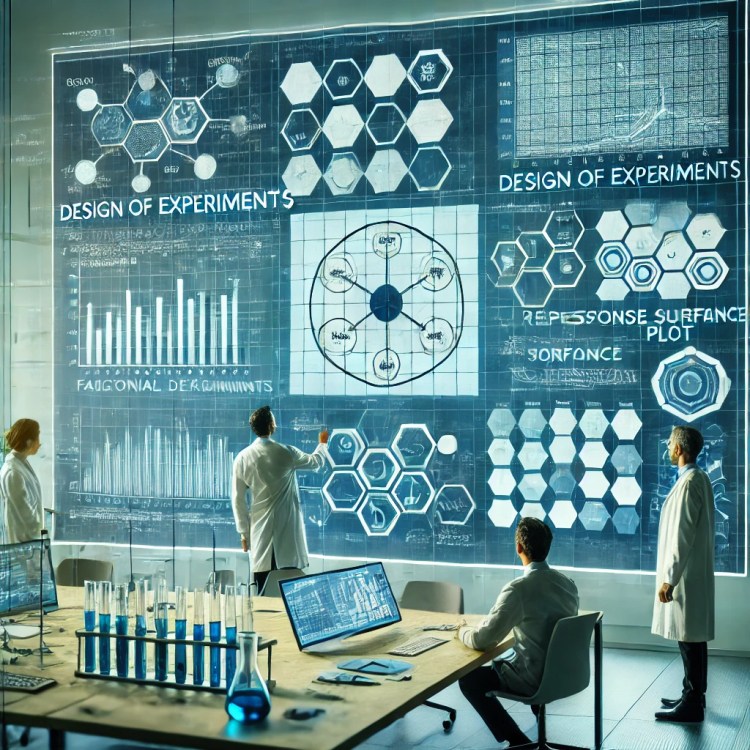
I distinctly remember how during my PhD I was changing one experimental parameter at a time. I repeated this day over day, hoping for a miracle. It took me nearly two years to arrive at a satisfactory recipe. The wiser me now can only lament about the lack of awareness of a technique called Design of experiments (DOE). DOEs are a structured method of experimentation that helps arrive at the answer quickly and more efficiently. DOEs can be used to make and validate discoveries or optimise processes. More about this in a later blog but note that DOEs are extremely crucial for process development.
DOEs were uncommon in materials science until recently. For those with a programmatic brain, languages like Python have simplified running DOEs and statistical analyses. Software like JMP and Minitab has made this even easier today. So, no more excuses when it comes to experimenting efficiently.
Materials
Materials, in Ishikawa’s 6M, are the raw inputs that undergo transformation during the process. From a process development perspective, the “Material” is final product the process produces and the raw inputs, precursors. Discovery of new materials, procedural innovation, precursor quality and consistency, product repeatability are central. Key questions include:
- Are precursors sourced from reliable suppliers?
- Do the materials meet the required specifications?
- How are the materials made?
- What are the properties of the material?
Machines
Machines and equipment are inherent to a process. From simple tools to complex automated systems – all facilitate the execution of a process. Therefore, proper machine selection, maintenance, and calibration are vital for efficient operations. It is equally important that the working of the tool being used for producing the material is well understood. Key considerations include:
- How does the machine work?
- Is the machine or equipment the right choice?
- Is the machine operating at optimal conditions?
- Is the equipment appropriate for the scale and complexity of the task?

Measure
Every Process has one or more key performance indicators (KPIs). This is industrial jargon for metrics, numbers or attributes that tell you how well your process has performed. Measure concerns with ensuring that right techniques and tools are used to extract the right KPIs correctly. Generation of this quantitative data also aids in quality monitoring and optimisation of the process itself. Key questions include:

- Are the KPIs being measured?
- Are the metrics meaningful and actionable?
- Are the measurement tools calibrated and have the right resolution?
- Are the tools repeatable and reproducible?
Measurement systems analysis (MSA), uncertainty budgets etc. are important techniques employed to ensure the measurements are repeatable and reproducible. Academic research mostly relies on basic uncertainty analysis. In contrast, industrial R&D favours using Gauge R&R and similar MSA techniques to evaluate variability in KPIs due to measurement.
Math
The key to understanding a process lies in gathering and understanding the data the process produces. Hence, a good grip on math and data analysis becomes important. Statistical analysis enables data-driven decision-making and process optimisation. What that means is that you can tell your boss/supervisor why you’re right about the process! Key aspects include:
- Applying statistical methods to understand process variability
- Exploring trends in data and identifying relations between factors
- Predict and forecast process behaviour through data modelling.

Data analysis can be two-fold: (1) passive or exploratory data analysis (EDA) and (2) active or predictive data analysis (PDA). EDA uses visualisations and graphs to discover trends in data. PDA uses mathematical techniques like correlation and regression analysis, model fitting to uncover relations between variables.
Monitoring
Monitoring involves keeping track of the process over time. This includes statistical process control (SPC), real-time observation, and control of the machines to ensure they operate within specified parameters. Monitoring of a process is crucial for identifying deviations early and taking corrective actions. Key questions to consider:

- Are sensors and controls reliable and accurate?
- How is the data being recorded and reviewed?
- Are SPC techniques implemented effectively?
- Are out of control action plans available?
Conclusion
Viewing a process through the lens of the 6M’s provides a structured approach to understanding and optimising material production. This framework not only ensures that every aspect of the process is accounted for. It also integrates seamlessly with tools like the Ishikawa diagram and DMAIC methodology to diagnose and improve process performance. By focusing on these elements, manufacturers can achieve greater consistency, efficiency, and innovation in their operations.
Keywords: manufacturing, process development, 6M menthod, Six Sigma, DMAIC, statistical process control, design of experiments.
Appendix
Ishikawa Diagram
The Ishikawa diagram, also known as the Fishbone or Cause-and-Effect diagram, is a pictorial representation of all potential causes of a problem. Originally developed by Dr. Kaoru Ishikawa, it organises the causes into six main categories: Method, Materials, Machinery, Measurement, Mother nature (environment), and Manpower (people). One can systematically identify and address root causes of process inefficiencies or defects through these 6Ms. For more information, refer to Ishikawa’s foundational work on quality control techniques, consult resources on Fishbone diagram methodology or read about it here in the future.
DMAIC approach
The DMAIC (Define, Measure, Analyze, Improve, Control) framework is a structured problem-solving approach widely used in process improvement, particularly in Six Sigma methodologies. The concepts of Measurement, Math, and Monitoring discussed above align closely with the Measure, Analyse, and Control phases of DMAIC. To learn more, explore authoritative resources on Six Sigma methodologies and the DMAIC framework.
References
- Ishikawa, K. (1986). Guide to Quality Control. Asian Productivity Organization.
- American Society for Quality (ASQ). “Cause-and-Effect Diagram (Fishbone Diagram)” [Online Resource]. Retrieved from https://asq.org
- Six Sigma Institute. “DMAIC Methodology Overview.” [Online Resource]. Retrieved from https://sixsigmainstitute.org
- Montgomery, D. C. (2009). Introduction to Statistical Quality Control. John Wiley & Sons.
- All custom images in this blog were AI-generated with input from ChatGPT to visually represent key concepts.
